Interest rates and deflation
Scott Sumner argues that when the monetary base is fixed, low interest rates are deflationary. I've emphasised the fixed monetary base because it is an important condition. If the monetary base is NOT fixed then the relationship between low interest rates and deflation is much less clear.
Logically, this makes sense. If the supply of base money is fixed, then falling interest rates indicate* rising demand for base money, increasing its value and therefore causing prices to fall. Aficionados of a classical gold standard will recognise this as "benign" deflation. Falling interest rates when the monetary base is fixed can be an indicator of healthy growth.
Unfortunately the period that Sumner chooses as his example of falling interest rates and a fixed monetary base was anything but healthy. It was August 2007 to May 2008, which was the height of the subprime crisis and encompassed the failure of Bear Sterns.
Strictly speaking, the monetary base was not "fixed" at this time - as this graph shows, it roughly tracked M1 with a lag:
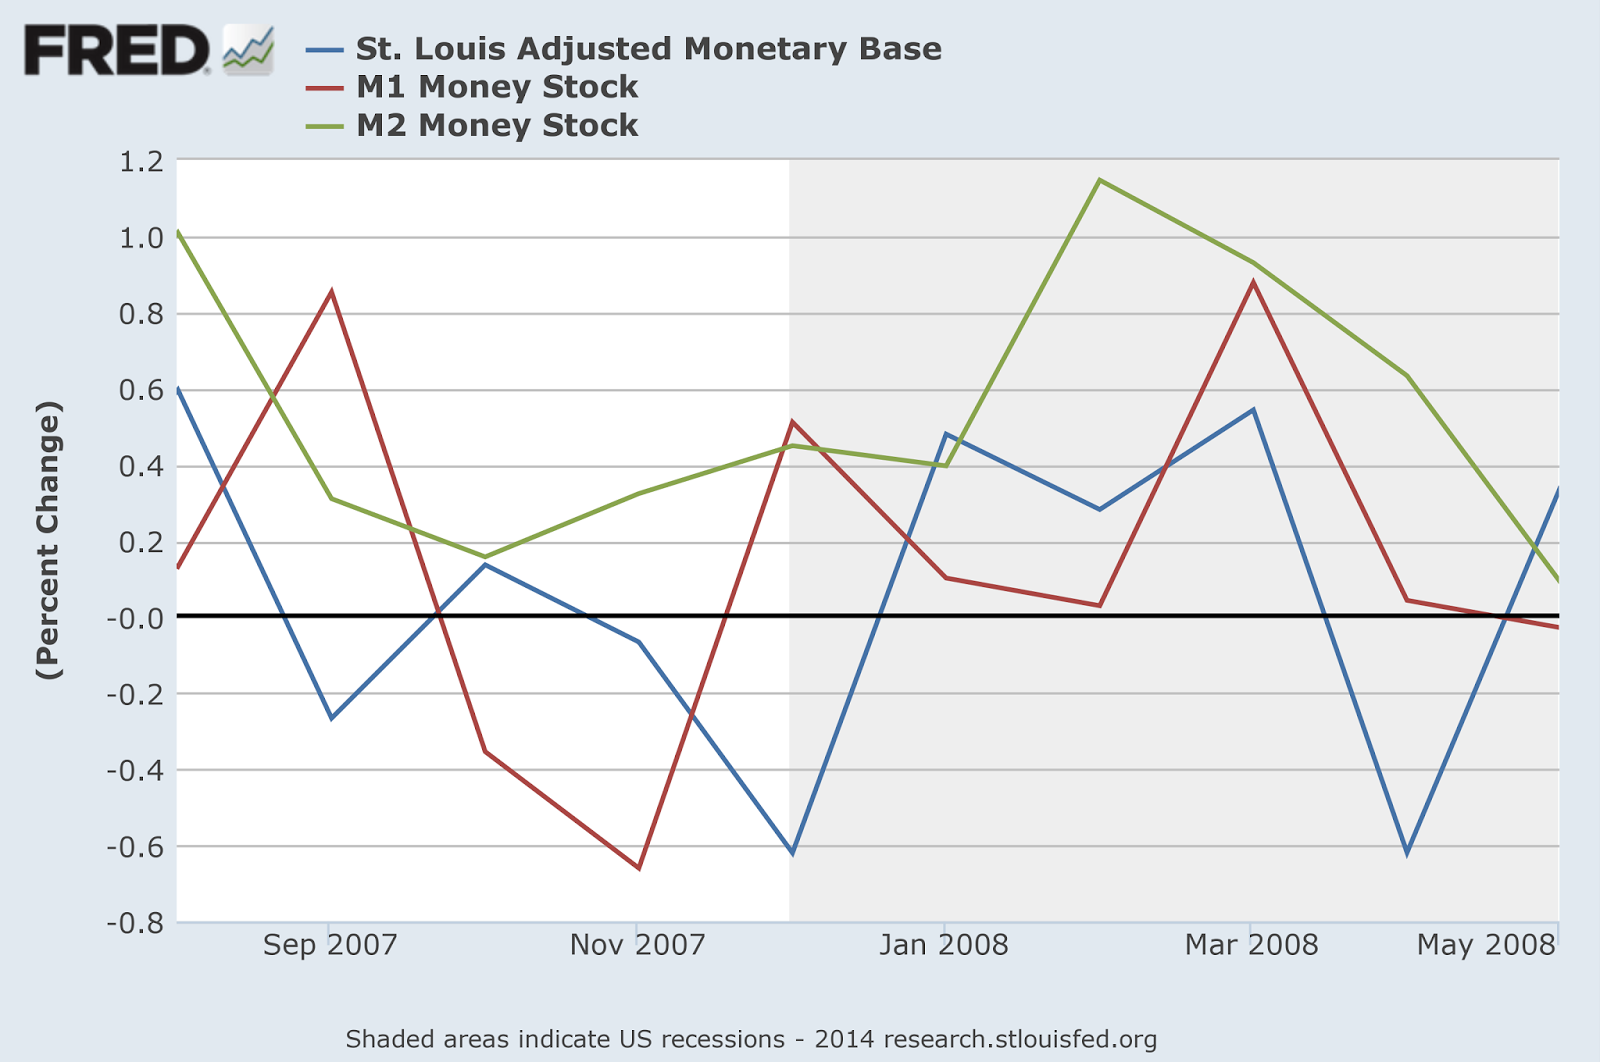
However, it did not grow overall, hence Sumner's description of this as a period when the monetary base was fixed.
But this simply won't do. The variation in the monetary base during this period DOES matter, because of what it tells us about Fed policy at the time. The Fed was not holding the monetary base fixed and allowing the interest rate to fall, which is what Sumner implies. It was actively supporting the Fed Funds rate.
The Fed Funds rate is not simply a market interest rate. At the time, it was the primary monetary policy tool, though these days - because of the presence of excess reserves in the system - it has been superseded by the interest on reserves (IOR) rate. Pre-QE, the Fed targeted a particular Fed Funds rate by adjusting the quantity of the monetary base using open market operations. You can see clearly from the graph that at times the monetary base actually shrank, which would have been caused by the Fed draining reserves.
The Fed Funds rate fell throughout this period:

But without the Fed's intervention to drain reserves, the rate would have fallen even further.
Sumner seems to think that the Fed should not have supported the rate by draining reserves. On he contrary, he explicitly blames the Fed's failure to expand the monetary base at this time for the subsequent collapse of NGDP:

Expansionary monetary policy when inflation was already so far above target would have seemed like madness. Even since the crisis, it takes a brave central bank to hold its nerve and its expansionary policy when inflation is a long way above target, as the Bank of England has discovered.
Nor would NGDPLT targeting necessarily have made much difference to Fed policy. We now know, with the benefit of hindsight, that NGDP was going to fall off a cliff in September 2008. But at the time, NGDP didn't show much sign of such a dramatic collapse:

In short, if you look ONLY at monetary aggregates and inflation, it is hard to argue that the Fed's policy during this period was too tight. With hindsight we can see that the falling interest rate and lack of monetary base growth was warning of impending crisis: but at the time the main worry would have been inflation well above target. The remarkable thing is that the Fed allowed interest rates to fall as much as it did.
So falling interest rates at this time did indeed indicate deflation, but not the healthy kind. How do we distinguish between falling interest rates that indicate healthy growth (in a period where the size of the monetary base does not change significantly), and falling interest rates that indicate the start of a debt deflationary spiral? Or (assuming that the size of the monetary base is not fixed), how do we distinguish between a gentle downturn which will sort itself out in due course and the start of a disastrous NGDP collapse?
For me, the answer is to look at a wider range of indicators. Had the Fed in 2007-8 taken more account of conditions in the housing market and financial markets (and less notice of inflation), monetary policy might indeed have been much looser, and the appalling crash of NGDP might have been averted. Therefore I welcome the recent decision by the Bank of England and, now, the Fed to take into account a wide range of economic indicators when making monetary policy decisions. Those in favour of a strict rule-based approach to monetary policy based on something like an NGDPLT target will no doubt be disappointed: but as I said above, I don't think an NGDPLT target would not necessarily have resulted in a markedly different policy stance in the crucial early part of the financial crisis.
The truth is that the economy is a great deal more complex than one indicator can show, and making policy decisions on the basis of one indicator alone (or one type of indicator) can have seriously damaging effects.
Related reading:
The postbellum deflation and its lessons for today - Beckworth
A plea for (mild) deflation - Selgin
Deflation is not benign - Forbes
Making the desert of plenty bloom - Pieria
* Sumner says "falling interest rates boost demand for base money". I am unconvinced that falling interest rates necessarily cause increased demand for base money, so I have said "indicate", which acknowledges correlation but leaves the causal direction undefined.
Logically, this makes sense. If the supply of base money is fixed, then falling interest rates indicate* rising demand for base money, increasing its value and therefore causing prices to fall. Aficionados of a classical gold standard will recognise this as "benign" deflation. Falling interest rates when the monetary base is fixed can be an indicator of healthy growth.
Unfortunately the period that Sumner chooses as his example of falling interest rates and a fixed monetary base was anything but healthy. It was August 2007 to May 2008, which was the height of the subprime crisis and encompassed the failure of Bear Sterns.
Strictly speaking, the monetary base was not "fixed" at this time - as this graph shows, it roughly tracked M1 with a lag:
However, it did not grow overall, hence Sumner's description of this as a period when the monetary base was fixed.
But this simply won't do. The variation in the monetary base during this period DOES matter, because of what it tells us about Fed policy at the time. The Fed was not holding the monetary base fixed and allowing the interest rate to fall, which is what Sumner implies. It was actively supporting the Fed Funds rate.
The Fed Funds rate is not simply a market interest rate. At the time, it was the primary monetary policy tool, though these days - because of the presence of excess reserves in the system - it has been superseded by the interest on reserves (IOR) rate. Pre-QE, the Fed targeted a particular Fed Funds rate by adjusting the quantity of the monetary base using open market operations. You can see clearly from the graph that at times the monetary base actually shrank, which would have been caused by the Fed draining reserves.
The Fed Funds rate fell throughout this period:
But without the Fed's intervention to drain reserves, the rate would have fallen even further.
Sumner seems to think that the Fed should not have supported the rate by draining reserves. On he contrary, he explicitly blames the Fed's failure to expand the monetary base at this time for the subsequent collapse of NGDP:
Between August 2007 and May 2008 there was no change in the monetary base, and yet interest rates fell sharply. Not surprisingly NGDP growth slowed and we tipped into recession.But the problem was inflation:
Expansionary monetary policy when inflation was already so far above target would have seemed like madness. Even since the crisis, it takes a brave central bank to hold its nerve and its expansionary policy when inflation is a long way above target, as the Bank of England has discovered.
Nor would NGDPLT targeting necessarily have made much difference to Fed policy. We now know, with the benefit of hindsight, that NGDP was going to fall off a cliff in September 2008. But at the time, NGDP didn't show much sign of such a dramatic collapse:
In short, if you look ONLY at monetary aggregates and inflation, it is hard to argue that the Fed's policy during this period was too tight. With hindsight we can see that the falling interest rate and lack of monetary base growth was warning of impending crisis: but at the time the main worry would have been inflation well above target. The remarkable thing is that the Fed allowed interest rates to fall as much as it did.
So falling interest rates at this time did indeed indicate deflation, but not the healthy kind. How do we distinguish between falling interest rates that indicate healthy growth (in a period where the size of the monetary base does not change significantly), and falling interest rates that indicate the start of a debt deflationary spiral? Or (assuming that the size of the monetary base is not fixed), how do we distinguish between a gentle downturn which will sort itself out in due course and the start of a disastrous NGDP collapse?
For me, the answer is to look at a wider range of indicators. Had the Fed in 2007-8 taken more account of conditions in the housing market and financial markets (and less notice of inflation), monetary policy might indeed have been much looser, and the appalling crash of NGDP might have been averted. Therefore I welcome the recent decision by the Bank of England and, now, the Fed to take into account a wide range of economic indicators when making monetary policy decisions. Those in favour of a strict rule-based approach to monetary policy based on something like an NGDPLT target will no doubt be disappointed: but as I said above, I don't think an NGDPLT target would not necessarily have resulted in a markedly different policy stance in the crucial early part of the financial crisis.
The truth is that the economy is a great deal more complex than one indicator can show, and making policy decisions on the basis of one indicator alone (or one type of indicator) can have seriously damaging effects.
Related reading:
The postbellum deflation and its lessons for today - Beckworth
A plea for (mild) deflation - Selgin
Deflation is not benign - Forbes
Making the desert of plenty bloom - Pieria
* Sumner says "falling interest rates boost demand for base money". I am unconvinced that falling interest rates necessarily cause increased demand for base money, so I have said "indicate", which acknowledges correlation but leaves the causal direction undefined.

I'm not sure that this line of argumentation takes on Sumner's arguments. For example, Sumner seems to be really big on anticipated NGDP, and the assumption that the THREAT of control over the monetary base stimulates NGDP through rational expectations, so that modest NGDP declines in his regime represents a different condition from falling NGDP in whatever regime the US had in the first half of 2008. Movements in monetary base are ambiguous with respect to the monetary stance, unless the Fed has developed some credibility about the future path and levels of the base.
ReplyDeleteAl,
DeleteI'm only addressing Scott's arguments in this particular post, not in general. The problem in this case is partly forecasting, and partly interpretation: as I said in the post, when the NGDP fall is gentle - as it was in early 2008 - how do you distinguish between a mild deflationary trend that is essentially benign, and the start of a disastrous deflationary collapse? No-one was particularly worried in early 2008, but Scott is effectively saying that they should have been (with which I agree, actually). See David Beckworth's comment below.
Frances, I believe elsewhere Scott Sumner has said the Fed's big failures were during the second half of 2008. I think you both agree on that.
ReplyDeleteMy view is that the Fed was doing a relatively decent job up through the first half of 2008. There was no 'Great Recesison' up to that point, just a mild recession that had been going on officially since December 2007 (though housing started collapsing in April, 2006). So yes, a NGDP target probably would not have signaled any alarm at that time. After that point, though, actual NGDP and expected inflation--a crude indicator of future NGDP--both were signalling trouble ahead. Monthly NGDP was falling and so were breakevens. Here is a recent post that shows these developments: http://macromarketmusings.blogspot.com/2014/02/spawning-great-recession.html
Hi David,
DeleteYes, he has, and I totally agree with him - as I do about the role of tight monetary policy in the Eurozone crisis too.
My wider point is that the financial crisis actually started in August 2007 with the ABCP market freeze that caused the interest rate falls that Scott noticed. Scott specifically says that monetary policy was too tight from that moment on, and I agree with him about that too. But the indicators at the time didn't suggest anything particularly worrying. NGDP didn't start to decline for another four months, and even then the fall was gentle to start with. So by the time NGDP was falling fast enough to worry people, it was already too late. That's why I think an NGDP target would not have averted the crisis, though it might have made it less severe. I honestly don't know how you deal with such an extreme forecasting problem, but it seems to me that monetary indicators alone are not enough.
Frances, yes, there is a lot going on in 2007. My thinking, and I think we disagree here, is that these developments did not matter too much since the Fed was able to largely offset their effect on aggregate demand until mid-2008. So the question for me is could the Fed have known in real time that they were effectively tightening monetary policy in the second half of 2008 by their inaction. My initial response is yes had they been looking at breakeven inflation. It was falling at atypical pace during this time. Monthly NGDP was also falling by June, 2008. But the Fed was not putting much weight on this measures. So even though there were signs, the way the FOMC operated almost guaranteed they would note take much notice. It would have been difficult for anyone on the FOMC to make it suddenly more focused on these measures. So while I blame the Fed for allowing a mild recession to morph into the Great Recession, I acknowledge there were institutional constraints that would have made it difficult for many to respond appropriately. What is less acceptable, in my view, is what happened afterward the economy bottomed out. But that is another discussion.
DeleteBy the way, thanks for plugging my article above.
David, no I don't think we do disagree, actually, or not by much! My general point is that the FOMC's focus is too narrow, and that replacing narrow focus on one indicator with narrow focus on another doesn't solve the problem. There were indeed other indicators that were indicating that monetary policy was too tight - I haven't looked at breakeven inflation but I'm quite happy to accept that that was one of them.
DeleteWhere we perhaps differ is that I don't think the Fed offsetting the effect on AD of a growing financial crisis in its early stages had any hope at all of preventing the later stages from happening. In fact it may even have numbed policy makers into believing that there wasn't really a problem. I think we have seen the numbing effect on policy makers of successful short-term monetary policy since the financial crisis, too - the UK at the back end of 2010 springs to mind.
Frances, this slightly off topic but I followed some of your links above and noted you claimed the following about a benign deflationary environment: "[F]or production costs to fall, either there must be fewer people earning wages, or wages must be lower." This need not be the case and is not kind of benign deflation to which George Selgin and myself are sympathetic. We focus on productivity-driven deflation. Productivity gains translate into lower per unit production costs but this development can occur with stable employment and stable nominal wages.
DeleteImagine an auto plant gets a new technology that doubles the number of autos being produced for every worker. The cost of the workers are now spread over more autos. Therefore, the cost of the workers are now cheaper per car even though their wages have not changed. The firm's profit margins are now higher and the firm owners are tickled. They soon realize they can lower their sale price to steal buyers from competitors and still have a profit margin at the same level (or higher) as it was before the productivity gains. No worker has had their wage cut and no one loses their job.
Now assume this is a technology that hits the entire economy--all firms have access to it. The same story is repeated, but now everyone is trying to steal market share by lowering their sale price. They lower their price up to the point where they had their profit margins before the technology was introduced. Collectively, these actions will lower the price level.
In this scenario, the workers' nominal wages are stable but their real wages are increasing. They are sharing in the productivity gains by the falling price level. Their stable dollar incomes are going further and further as the price level falls. This is George Selgin's Productivity Norm rule for monetary policy. It is a special case of NGDP targeting.
The problem occurs when the central bank tries to offset this 'benign' deflation. Offsetting malign deflation is important, but responding to benign deflation will create problems. Instead if the central bank aimed on keeping nominal wages or income stable (i.e. a NGDP target), it should ignore changes in the price level arising from productivity gains. In short, the central bank should only respond to aggregate demand shocks, but ignore aggregate supply shocks.
For those concerned about the laborer's plight in a post-scarcity world should be readily embracing Selgin's Productivity Norm.
David,
DeleteI think that's my Forbes post, yes? I didn't want to give the Forbes goldbugs any ammunition!
More seriously, though: in theory, yes if everyone were employed and productivity increases never meant job losses, or if they did there were always replacement jobs at similar wages, then deflation as a consequence of productivity increases would indeed be benign. But that's not the post-scarcity world we are looking at, sadly. I wish it were.
I've written a lot about labour markets in a post-scarcity economy. Rather like Krugman, I reached the conclusion that such an economy could be seriously demand-constrained. I'm not Luddite, and I don't subscribe to the "lump of labour" fallacy, but equally I'm not convinced that a technological revolution that results in abundance of most goods and services would necessarily result in well-remunerated employment for all. It could just as easily result in very little well-remunerated work for anyone. I am of course anticipating that in due course new forms of "work" would emerge - as they eventually did in the industrial revolution, of course. But until then, there could be an awful lot of people for whom technological improvements mean scarcity of work and a serious fall in real income as they are either replaced by robots or their wages fall to below the running cost of robots. Under these circumstances, deflation caused by productivity increases would certainly not be benign.
It was doing this analysis that led me to promote a basic income.
That's good that If the supply of base money is fixed, then falling interest rates indicate* rising demand for base money, increasing its value and therefore causing prices to fall.
ReplyDeleteThe starting premise of Scott Sumner's article is wrong. The correct description of the situation is, that comparatively low interest rates are the product of exchanges where, compared to the norm, bonds are highly valued and money is lowly valued.
ReplyDeleteFrances, I have a question about Scott's 1st plot. I wrote it out here:
ReplyDeletehttp://pragcap.com/of-course-all-economists-already-understood-the-money-multiplier-not/comment-page-2#comment-171087
Can you explain what's wrong with my logic there? Thanks.
Actually, I think I've got it now... but feel free to take a look and comment anyway.
DeleteGah. I left a long explanation on PragCap, but I think it's gone into spam. Should have copied it to the clipboard before posting!.
DeleteIf Cullen retrieves it I will repost it here.
Tom,
DeleteHere's a brief explanation of the main points though.
Nick has lost a reciprocal. Really what he was doing was replacing 1/P on the y axis of Scott's diagram with 1/NGDP, as Scott suggested. So Mdn = 1/PY. That's why Nick's model is empirically wrong (and why you find it confusing). (And I thought my maths was bad!)
The way Scott's model fits with the IS/LM model should be obvious once you correct that reciprocal. Money supply is fixed. Liquidity preference (demand for money) increases as the interest rate falls, the IS curve shifts to the left and Y falls.
Nice, thanks. I saw your post at pragcap, but I like the short version too.
DeleteBut wait, it's not really Mdn = 1/(P*Y) is it? Nick writes it like Mdn = P*Y. Thus when 1/(P*Y) is on the y-axis, we have a nice hyperbola: x*y = constant, or in this case Mdn*(1/(P*Y)) = 1.
I know how Nick writes it, but it just doesn't make sense. it's not consistent with either the IS/LM model or Scott's model. If Scott is correct that demand for money is the inverse of the price level, i.e. Mdn = 1/P, then Nick can't possibly be right that Mdn = P*Y. And in the IS/LM model, increasing demand for money causes both Y and the real interest rate to fall because the IS curve shifts to the left, so Mdr =Y jut isn't possible - it should be Mdr = 1/Y*r, surely? Either Scott and Hicks/Keynes are right or Nick is.
DeleteFrances, here's what I understood, both from Wikipedia ( :D ) and from another random blog I found (great sources, eh?)
DeleteMdr = real demand for money = Mdn / P = nominal demand for money (Mdn) / Price level (P)
So it's not that Mdn = 1/P, it's that when plotting the nominal quantity of money demanded (Mdn) on the x-axis for a constant real demand for money (Mdr = constant), then you get those "rectangular parabolas" that Scott drew, and that Nick described to me in text. Here's one source for that:
http://slulibertarians.tumblr.com/post/33623592973/the-strange-economics-of-money#notes
Here's the Wikipedia article I was going from:
http://en.wikipedia.org/wiki/IS%E2%80%93LM_model
So rather than an LM curve, after reading the Wikipedia piece, I realized that the curve itself is not for a constant M: each point on it represents the crossing of two other curves plotted against a different x-axis: the "liquidity preference" curve (L) and the "money supply function" (i.e. a vertical line) on a plot with quantity of money on the x-axis and interest rates on the y-axis. The show a formula like this (which is similar to Nick's):
M/P = L(i,Y)
Where i = nominal interest rates, Y = total output, P = price level, M/P = real quantity of money supplied, and M = nominal quantity of money supplied. Sor for each solution to this equation (each potentially at a different M) we fill in all the points in the LM curve.
L is described as "the quantity of cash balances demanded" ... as well as "liquidity preference" ... so it is the money demand function, and it is apparently the "real money demand" function based on what's being normalized by P. This is consistent with Nick's description, only he writes it with L taking P as an argument. Mdn = L(P,Y,r) in Nick's post. But if we stick with Wikipedia's notation we have:
M = P*L(i,Y)
Wikipedia goes on to say that L is a downward sloping function (again with i on the y-axis and quantity of money on the x-axis), and furthermore that L goes up with increasing i (consistent with Scott's 1st plot) and that it goes up with increasing Y (consistent with your point about Y to Scott).
The dependence of L on i they describe as "Speculative demand" (which is the "opportunity cost" of holding cash I was imagining).
The dependence of L on Y they describe as "Transactions demand" (which I ignored, but you didn't).
So regarding the IS/LM plot and the IS curve shifting: you lose me there. But again, M is not being held constan on that LM curve. But we do know how to hold it constant for the L curve, which is what the Wikipedia article describes.
Does any of that make sense? I hope so because I was just starting to converge to an answer (this is the 1st time I'm looking into this stuff). If not, it's back to the drawing board for me. :D (It wouldn't be the 1st time!!)
So in Scott's 1st plot, when he shows the solution going from curve D to D' and he says that the "demand for money increased" ... what that means to me is that D' is the nominal demand for money curve plotted for a fixed REAL demand for money which is greater than the fixed real demand for money used to plot the D nominal demand for money curve. So in other words, nominal demand didn't change in Scott's 1st plot because we only moved vertically: no horizontal component (nominal demand/supply is on the x-axis). Thus what changed was real demand, and Mdr' > Mdr (with Mdr' = D'/P and Mdr = D/P).
Delete... above I wrote "rectangular parabolas" ... I meant "rectangular hyperbolas," in other words this:
Deletex*y = constant.
Or in terms of what Scott plotted and my random blog source plotted and what I plotted (following Nick's text instructions) was
(1/P)*Mdn = Mdr
For fixed Mdr, and the nominal quantity demanded (Mdn) on the x-axis and 1/P on the y-axis. (Apparently I'd missed a day in quadratic surfaces class because when he first mentioned "rectangular hyperbola" I thought that was something that he'd invented... some sort of squared off looking version of a hyperbola with sharp corners or something... Ha!!):
http://mathworld.wolfram.com/RectangularHyperbola.html
I wrote:
Delete"and furthermore that L goes up with increasing i"
But that should be
"and furthermore that L goes up with decreasing i"
(I wish there was a way to edit our comments... )
Tom,
DeleteNominal M is fixed, since it is exogenous. Because it is looking at short-run effects, the IS-LM model ignores inflation, so all variables are real and real M is fixed (assume P=1). Note that the interest rate is the REAL interest rate r, not the nominal interest rate i as you said - Wikipedia confuses things by using i to mean the real interest rate. L is then some function of Y and r. M=L(Y,r)..
If you introduce price into the model, then M = M/P, in which case M is variable as you said.
Then nominal money supply M = P*L(Y, r) - which is Wikipedia's formula corrected for the real interest rate.
What Nick has done is this:
Mdr = L(Y,r)
Mdn = Mdr*P
therefore Mdn = P*L(Y,r).
The point I was making is that the function L(Y,r) is a reciprocal. Liquidity preference L rises as Y and/or r fall, i.e. the L curve is downward sloping (Wikipedia says this, actually).
I think it is important for us endogenous money types to understand the significance of the IS curve. In the IS-LM model, demand for money is inversely proportional to demand for credit. The intersection of the IS curve with the LM curve tells us the relative demand for credit versus money (M) for a given combination of interest rate and output. The IS curve shifts in response to changes in demand for M. When the IS curve shifts leftward and the intersection with the LM curve moves downward, demand for loans has reduced and therefore the amount of credit in the economy has fallen relative to the monetary base. In endogenous money we would say that outside money hasn't changed but inside money has reduced. In Scott-speak we would say that the money multiplier (ratio of monetary base to credit money) has reduced. It's the same thing, and the effect is the same - output (Y) falls.
Does this make sense?
MM and MR are brothers under the skin.
ugh, that should be "real M = M/P" of course. Oh for a subscript function in Blogger comments.
DeleteFrances, interesting point about nominal vs real interest rates. The Wikipedia article does say this though:
Delete"In the money market equilibrium diagram, the liquidity preference function is simply the willingness to hold cash balances instead of securities. For this function, the nominal interest rate (on the vertical axis) is plotted against the quantity of cash balances (or liquidity), on the horizontal."
Do you think they have that in error?
Also, you write:
"Liquidity preference L rises as Y and/or r fall, i.e. the L curve is downward sloping (Wikipedia says this, actually). "
Yes, I agree that it's downward sloping, with i on the y-axis, and Mdr on the x-axis. So yes, greater real demand for money corresponds to lower interest rates. But it also says this:
"Transactions demand is positively related to real GDP (represented by Y,and also referred to as income). This is simply explained – as GDP increases, so does spending and therefore transactions"
So Y up means transaction demand up, which is one of the two components for L they discuss. The other component being speculative demand:
"Speculative demand is inversely related to the interest rate."
So shouldn't your sentence read like this instead:
"Liquidity preference L rises as Y rises and also rises as r falls, i.e. the L curve is downward sloping (Wikipedia says this, actually). "
Thanks for the great feedback!
I have to think about your last paragraph further. But I have had this suspicious for some time:
Delete"MM and MR are brothers under the skin. "
Tom,
DeleteNo, they are right. They aren't talking about the IS-LM model here - they are talking about the money market equilibrium. The money market equilibrium graph plots the supply and demand curves for money with the nominal interest rate on the y axis and nominal M on the x axis:
http://www.bized.co.uk/sites/bized/files/images/diagrams/big/ir_eq.gif
(sorry, links are not live, you will have to copy into your browser)
On your second point, yes you are right. It should be worded as you say. Higher transactions demand raises both Y and L. But the point is that the L curve slopes downward.
If you multiply the number of target variables will you not end up with no way to decide monetary policy except hunches by the officials running the central bank? They will just switch to what ever numbers support what they want to do.
ReplyDeleteDon't think Mdr=1/Y*r is quite right - it's late, I am tired and maths is not my strong point anyway. But you get my drift.
ReplyDeleteIf P is fixed (inflation targeting), then as Mdn rises, M increases - the money supply curve shifts to the right in Scott's diagram, stabilizing Mdn. That's Scott's second diagram. But it still doesn't eliminate the reciprocal. Mdn is still 1/P*Y, it's just that P is fixed so Mdn doesn't rise as much as it would if P was allowed to fall. I really don't see what Nick is trying to do.
If Mdn = 1/P*Y, the liquidity trap is obvious, isn't it? If P or Y fall to zero, demand for money is infinite.
Nice blogging, but...
ReplyDeleteWell...check out FOMC transcripts from 2008. They were compulsively obsessed with inflation right into the Sept. 2008 meeting.
Also you should post NGDP chart so we can see...
If the FOMC had been as fixated on monitoring and counter-acting the slightest whiff of recession in NGDP, we would have a different story....
Benjamin,
DeleteYes, I know they were obsessed with inflation. They even considered raising interest rates the day after Lehman failed. Utter madness.
However, I remain unconvinced that the Fed would have prevented the 2008/9 recession even if they were targeting NGDP. The dramatic fall in NGDP after Lehman and AIG failed and Reserve Primary broke the buck was sudden and unexpected. As David Beckworth points out. TIPS breakevens did indicate an impending liquidity crisis from July 2008 onwards - we can certainly criticise the Fed for taking no notice of that. But in the time period that Scott and I were discussing, although we both agree Fed monetary policy was too tight there was certainly no indication that anything other than a mild recession was in the offing. So I don't think we would have a different story - there would still have been a significant recession, though perhaps it would have been less deep and we might have recovered faster.
BTW Frances, congratulations on being the second most famous Franc[insert vowel here]s Coppola on Google. :D
ReplyDeleteWow.
DeleteBTW, I've visited here:
Deletehttps://www.francisfordcoppolawinery.com/visit
Any relation?
Not to me. A distant relative of my ex-husband. Nice wine though. :)
DeleteHi Frances,
ReplyDeleteI’m no expert on ISLM, but a couple of thoughts:
First, (side-bar aspect) the Krugman post:
“You see that a lot among people who reject IS-LM as too simple and unsubtle: what they have ended up doing in practice, for the most part, is predicting soaring inflation and interest rates, because whether they know it or not they have effectively reverted to crude quantity-theory and loanable-funds models.”
I don’t quite understand this comment. He’s not talking about post Keynesians or “endogenous money types” here, it he? Rather about freshwater “dark age of macro types” like Lucas, etc. And their beef is not about the simplicity of ISLM but the irrelevance of Keynesianism in all forms. Yet the simplicity criticism comes mostly from post Keynesian types.
Second, regarding your comment above, not sure I understand:
“I think it is important for us endogenous money types to understand the significance of the IS curve. In the IS-LM model, demand for money is inversely proportional to demand for credit. The intersection of the IS curve with the LM curve tells us the relative demand for credit versus money (M) for a given combination of interest rate and output. The IS curve shifts in response to changes in demand for M. When the IS curve shifts leftward and the intersection with the LM curve moves downward, demand for loans has reduced and therefore the amount of credit in the economy has fallen relative to the monetary base. In endogenous money we would say that outside money hasn't changed but inside money has reduced. In Scott-speak we would say that the money multiplier (ratio of monetary base to credit money) has reduced. It's the same thing, and the effect is the same - output (Y) falls.”
The LM curve is a fixed money curve, no? So I’m not sure how the IS curve sliding left is supposed by the model to mean that credit has actually fallen. That would suggest that money has also changed. Or is that your point – you are relating the fixed money assumption to the monetary base and letting broad money float?
Sorry, I think I’ve jumped in here about 80 per cent late on discussions you’ve been having and I haven’t been following. So please set me straight me as necessary.
Hi JKH,
DeleteAs someone said on Twitter, Krugman appears to have confused Lars Syll with Peter Schiff. Lars was making a powerful point about the impossibility of reflecting Knightian uncertainty in simple macroeconomic models such as IS-LM. Krugman didn't really address the substance of his post at all.
Krugman's point is dangerously close to the argument that only economic concepts expressed in mathematical language are important, That is how Minsky's theories came to be sidelined for so long. Having said that, though, personally I find IS-LM a powerful tool if it is correctly used. The trouble is that most people get it wrong.
In the IS-LM model M is base money. Inflation is ignored (because it is a short-run model), so M is nominal. The supply curve for M is a vertical line, so the nominal monetary base is fixed (not surprisingly since the IS-LM model comes from a gold standard era). Broad money (represented by the IS curve) floats in relation to the monetary base, and the ratio of the two is the money multiplier.
The money multiplier has been widely misinterpreted as an ex ante determinant of the amount of money that banks are "allowed" to create, when it is actually an ex post descriptor of the amount of money banks HAVE created in relation to base money - i.e. the demand for credit, which is an important driver of nominal GDP.
I visualise this as the IS curve "sliding" up and down the fixed LM curve. I so want an interactive graphic for this! It would be really handy for showing how real interest rates and output respond to the creation and destruction of credit money. Basically, real interest rates and output rise as more credit money is created, and fall as credit money is destroyed. It's an excellent depictor of the procyclicality of bank credit creation.
I don't think people should get hung up on what is implied by the IS curve (saving=investment). The IS relationship has also been widely misinterpreted, in this case to mean "there has to be saving in order for there to be investment", which implies that banks "lend out" deposits. But there is no such causal relationship. It is actually more accurate to say that investment drives saving (indeed this is how Andy Harless describes it), which is consistent with bank lending creating new deposits - when the deposit is spent (invested) it becomes the saving of the recipient.
If M "tracks" credit creation, as was the case prior to 2008, the LM curve rather than the IS curve shifts and the money multiplier remains constant. FRED shows the money multiplier as pretty much a straight line until 2008. But that's not the case now.
The UK actually has a completely fixed monetary base at the moment, since it is not doing QE but is maintaining its asset purchases at £375bn. The US's monetary base is still increasing, of course, though it is an exogenous increase rather than a response to credit demand. The classical IS-LM model with fixed LM therefore applies better to the UK than the US at the moment. But we should not use it as a determinant of monetary policy. It is a short-run model which describes an existing situation. It does not predict a future path.
I'm thinking aloud here, really - so do comment on the above.
Frances,
DeleteI certainly agree with the important substance of your points.
A few minor notes:
“In the IS-LM model M is base money”.
I don’t recall seeing that before. I thought it was undefined and up to the “user” to decide what M was. It just needs to be fixed under a given LM curve. Although the central bank could determine both base money and broad money along with it based on the simplistic gold standard / money multiplier type thinking you cite. Defining it as base money “works”, but I just don’t recall see that as a necessary specification of the model previously. But I don’t look at IS-LM very often.
I think your points on credit creation are good backfill to a model that doesn’t actually specify credit creation – it uses what is in effect national accounts construction for I and S without reference to flow of funds. In theory, ‘I’ can increase without credit creation – through retained earnings of corporations for example. And new houses can be purchased with existing cash (at least in part). So to that extent, a fixed money supply on a given LM curve can finance a right sliding IS curve through higher money velocity, which drives you up the LM curve as IS moves to the right. Your construction of it is more practical, but the truth is a mixture of velocity and credit effects – certainly not like Keens redefinition of aggregate demand for example.
I agree with your points on both money multiplier and IS causalities, of course. That old Harless post was a good one.
In fact, I think the ‘IS’ label is redundant – from the point of view that ‘I’ would suffice given the identity of I and S that must be in place at ALL times (assuming compatible sector treatments for the definition of I and S) for a “feasible” solution to “equilibrium”.
“If M "tracks" credit creation, as was the case prior to 2008, the LM curve rather than the IS curve shifts and the money multiplier remains constant.”
That’s another potential interesting interpretation of ISLM. One can have a little bit of fun with ISLM in that way. I had been thinking of doing a post on it some time ago but never got around to it. I think I would have emphasized my point above about the redundancy of what really is a necessary ‘I’ curve given the identity with S that must hold under any “feasible” solution for “equilibrium” of this type.
Regarding Krugman’s latest – he's switched over to ISMP at times over the past year in acknowledgment of the “interest rate school” (i.e. endogenous money) of central banking. I think he goes back to core ISLM here to make the point about the ultimate usefulness of it as a “gadget”, whatever refinements are superimposed on that.
P.S.
What's your interpretation of Krugman's definition and view of "loanable funds"?
JKH,
ReplyDeleteI did tweak the definitions in the IS-LM model somewhat, because I want to use it specifically to model the monetary system rather than the general economy.
I've used Scott Sumner's definition of M. Once you restrict the definition of M to monetary base, then all other forms of "money" have to be part of S (defined as a stock rather than a flow in this case, though that isn't how I would usually define S). It neatly avoids the "moneyness" problem without compromising L, since the ultimate in "liquidity" for non-banks is currency. The classic retail bank run is the ultimate slide down the LM curve, since people reject bank money in favour of physical cash.
When you treat bank money as part of S, then the fact that people buy other assets with it doesn't matter - it's simply the exchange of one risky asset for another. It's the creation and destruction of bank money that causes the IS curve to shift. That's how I see it, anyway.
TravisV here from themoneyillusion comments section.
ReplyDeleteFrances Coppola,
You might be interested in checking out Glasner and Sumner’s strong agreement on the “root causes” of the Great Depression. Here’s Sumner:
http://www.themoneyillusion.com/?p=4220
http://vimeo.com/11700175
And here’s Glasner:
http://uneasymoney.com/2013/08/21/why-hawtrey-and-cassel-trump-friedman-and-schwartz
And here’s a great video where Sumner provides his detailed view of the 2008 Great Recession:
http://vimeo.com/38915078
TravisV here from themoneyillusion comments section.
ReplyDeleteI encourage you to further study the material of Glasner and Sumner. Two brilliant economic historians largely operating independently arriving at very very similar conclusions.
Another thing: Glasner’s ideology might appeal to you more than Sumner’s.
Sumner, Marcus Nunes and Morgan Warstler lean right with their ideologies while Glasner and Mark Sadowski lean left.
I suspect that Glasner receives more love from Krugman, Noah Smith and John Aziz because he leans more left than Sumner does.
However, Sumner is a very open-minded guy. If you dig a little deeper, you’ll see that he’s a utilitarian who actually agrees with numerous left-wing arguments.
Travis, nice to see you here. And thanks for the links. I have a free afternoon today, so you have provided me with exactly what I need to fill it!
ReplyDeleteI read a wide range of material and have read some of Sumner's work before - rather less of Glasner's, I admit, though what I have read chimes very much with my own world view. As you may have gathered if you read my discussions with Tom Brown and JKH above, I like the rigour of Sumner's approach but I have some problems with the framing.
I'm determinedly apolitical, so "left" and "right" don't mean much to me. British "left" and "right" are different from the US anyway: our Conservative party is similar to your Democratic party and we don't really have anything like the Republicans, certainly not in mainstream parties. I suppose we are a much more left-wing society generally.
I don't know if you are aware that John Aziz is only a recent "leftie" - he used to have Austrian economic views and wrote occasionally for Zero Hedge. It's been very interesting watching (and influencing!) his conversion to a more Keynesian world view. He's my editorial colleague at Pieria.
TravisV here from themoneyillusion comments section.
ReplyDeleteFrances Coppola,
Hooray, appreciate your open-mindedness!
Those videos I linked to above are THE BEST but they take up substantial time.
Here's more Glasner and Sumner on 1933 and George Warren, FDR's agricultural economist who saved the world:
http://uneasymoney.com/2011/09/26/misrepresenting-the-recovery-from-the-great-depression
http://www.themoneyillusion.com/?p=308
Two posts where Sumner goes in-depth into "root causes" of the Great Contraction of 1929 and 1930:
http://www.themoneyillusion.com/?p=1680
http://www.themoneyillusion.com/?p=4286
And an old gem exploring the intellectual "zeitgeist" of the 1930's with several posts in the comments section from Glasner:
http://www.themoneyillusion.com/?p=3316
You should also check out Sumner's feverish posting in February, March and April 2009. It was truly heroic. Remember: everyone was saying "The Fed is out of ammo, the Fed is out of ammo!" Sumner was the lone voice in the dark saying over and over "That's not true!" And then Tyler Cowen linked to him and his ideas spread like wildfire........
He was right about the Fed.
DeleteMore recently he's been saying the same about the ECB. But in this case I don't wholly agree, not because it is inappropriate but because the inadequate institutional construction of the Euro emasculates monetary policy in the periphery. Monetary conditions there are very, very tight, and the ECB is so hedged around with treaty limitations and threats of legal action that it can do very little to ease the situation. I fear any monetary easing such as QE or Euro devaluation would benefit the core countries more than the periphery, making the existing bifurcation worse. The Eurozone periphery is in a depression without end while the Euro and its institutions remain unreformed and the ECB remains politically captive. I've written about this rather a lot myself - see here, for example:
http://coppolacomment.blogspot.co.uk/2014/03/deflation-and-ecb.html
Note the last paragraph. I'm arguing for the shackles to be removed from the ECB. As I said, the framing is different but in substance I'm not far removed from Scott's POV.
TravisV here from themoneyillusion comments section.
DeleteI'll study your stuff on the Eurozone more. But let me just note this: Krugman and Market Monetarists agree that the root of the problem is the common currency area. Namely, countries like Spain and Ireland really really really need a currency devaluation. However, they can't do it because they're stuck in the Euro.
Krugman made that point by comparing Spain with Germany and Ireland (stuck in the Euro) with Iceland (not stuck in the Euro):
http://krugman.blogs.nytimes.com/2010/02/09/anatomy-of-a-euromess
http://www.imf.org/external/np/seminars/eng/2011/isl/pdf/pk.pdf
And here's David Beckworth on the Eurozone's problems:
http://macromarketmusings.blogspot.com/2011/09/is-it-time-for-eurozone-to-get-rid-of.html
Hehe. They read me!
Deletehttp://krugman.blogs.nytimes.com/2013/06/03/the-triumph-of-peter-kenen-the-revenge-of-robert-mundell/?_php=true&_type=blogs&_r=0
The Euro is like a very badly constructed gold standard, with national central banks that have no control of monetary policy (it's all automated in the Target2 system) and a central "gold market" clearing house that calls itself a central bank but doesn't behave like one. Because the monetary mechanism is completely dysfunctional, fiscal policy has to do the heavy lifting. The trouble is that markets don't like that, so now the EU has disabled the fiscal approach too. Hence my comment about a depression without end. Krugman has said something similar - I've quoted him here:
http://www.pieria.co.uk/articles/can_labour_markets_be_too_flexible
TravisV here from themoneyillusion comments section.
DeleteYou have an interesting theory of why expansionary monetary policy from the ECB would be ineffective. And your theory might be right. Here's how I would test your theory:
I know two things: (1) over the past 18 months, the ECB has made a number of announcements that were surprisingly expansionary and (2) European stock prices are generally far higher than they were 18 months ago.
If, say, Spanish stocks reacted as positively or even more positively to those surprises than German stocks do, then I think the ECB could still really help Spain with aggressive QE and/or a higher inflation or NGDP target.
I might try to get Mark Sadowski to weight on this one later.
Travis,
DeleteI don't think we should ignore international effects. In my view it is mainly QE from other central banks that has been propping up the Eurozone, particularly the Fed and the SNB. Do you realize that the SNB's cap on CHF amounts to a massive QE programme - probably the largest in the world compared to the size of its economy? Now the Fed's QE is being tapered off, the BoJ is taking over the job of keeping the Eurozone afloat, along with recovery in the UK and the US ("a rising tide floats all boats"). ECB will get the credit for this, but I really don't think it deserves it.
TravisV here from themoneyillusion comments section.
DeleteKey question: over the past 18 months, what central bank news resulted in the biggest quick surges of Eurozone stock prices? Maybe news from the Fed / BOJ has been more influential than news from the ECB / Germany but then again maybe not.......
TravisV here from themoneyillusion comments section.
ReplyDeleteTwo other posts where Sumner explains how he took Friedman's approach and corrected its flaws using the insights of Lars Svensson, Michael Woodford and Robert King:
http://www.themoneyillusion.com/?p=2810
http://www.themoneyillusion.com/?p=753
Travis,
DeleteI've just watched the first Sumner video, on the Great Depression (as you say, it takes up some time!). I wanted to give you some feedback.
I already knew that the 1929 crash and the 1929-1933 contraction were due to conditions in the world gold market. The immediate cause of the Great Depression was the disorderly breakup of an overstretched international gold standard: there had been evidence of strain throughout the 1920s. I agree with Sumner that the final trigger was concurrent monetary tightening by all three major central banks, but it was going to break at some time anyway, I think. The ultimate cause was the unsatisfactory resolution of WW1 (which Sumner also mentions).
Sumner mentions the need for cooperation between central banks, a point also made by Liaqat Ahmed. But that was never really going to happen, because diplomatic relations in Europe were stretched to breaking point after WW1: the US and UK cooperated, but even that caused some bitterness (see Rothbard on this).
I've written about this here:
http://www.pieria.co.uk/articles/currency_wars_and_the_fall_of_empires
Note that I state here that I regard the failed attempt to restore the gold standard in the 1920s as the proximate cause of the Great Depression. I think this is consistent with Sumner's view.
I'm also pleased that Sumner mentions France, as does Glasner. Glasner describes the Bank of France as "insane": Sumner is more generous, simply saying France was pursuing its own national interests. But it was actually Michael Pettis who showed me the significance of France, and the price it paid for its "insanity". Friedman completely missed this. In fact most American analyses of the Great Depression largely ignore the European dimension, so this is refreshing
Thanks again.
TravisV here from themoneyillusion comments section.
DeleteHahahaha, yeah, I've read lots of Glasner's posts and he's said "insane Bank of France" over and over and over again.
On a more serious note, Glasner also notes how Friedman missed the powerful and rapid impact George Warren's gold purchase / dollar devaluation program had in 1933:
http://uneasymoney.com/2013/08/21/why-hawtrey-and-cassel-trump-friedman-and-schwartz
http://uneasymoney.com/2011/09/26/misrepresenting-the-recovery-from-the-great-depression
Glasner, Sumner and I believe that George Warren and 1933 illustrate that a country that is truly determined could put millions of unemployed people to work within a short period of time with aggressive currency devaluation.
Here's a post where Stiglitz suggested that the potential power of monetary policy is limited and Glasner STRONGLY objected:
http://uneasymoney.com/2011/08/10/the-fed-has-not-done-enough-and-it-has-not-fired-most-of-its-ammunition
TravisV here from themoneyillusion comments section.
ReplyDeleteFrances Coppola,
I read this paragraph you wrote:
http://www.pieria.co.uk/articles/the_ecb_is_irrelevant_and_the_euro_is_a_failure
"Whether or not the ECB does QE – or any other form of monetary easing, for that matter – will in the end make little difference. QE cannot be done in any way that would genuinely benefit the periphery without incurring political and legal challenge from Germany: there is already a legal challenge to the ECB’s OMT programme that has prevented Spanish and Italian yields from spiralling out of control. If QE were done in a more even-handed way (for example, buying a weighted basket of Eurozone government bonds) it would worsen the existing credit bifurcation by making German bunds even scarcer. There are other things that the ECB could do, such as another round of LTROs to prop up the Eurozone’s dysfunctional banks YET again, or FLS-style funding support for SME lending, or even buying up packages of SME bonds. It could even experiment with negative rates on reserves. But it’s all so much window dressing."
You might be right that the common currency area is hopeless and unsalvageable. However, the huge general increase in Eurozone stock prices over the past 18 months may suggest otherwise.
I bet even Spanish stock prices are higher now than they were 18 months ago, which indicates that sticky wage expectations are slowly adjusting, etc. Easier money would have made the adjustment far less painful. Nevertheless, I sense that positive adjustments are still happening that will result in full employment..........eventually. I pray to God that they figure out how to avoid deflation.
Travis,
ReplyDeleteWhat made by far the biggest difference to Eurozone bond prices was the OMT announcement. Prior to that, the ECB had given no indication that it would act to preserve the integrity of the Eurozone, so (with the precedent of ERM) markets were anticipating a possible disorderly breakup, one or more countries leaving and redenomination with a vast devaluation. OMT was a clear signal from the ECB that it would "do whatever it takes" (in Draghi's words) to preserve the integrity of the Eurozone. Unfortunately the legality of OMT has now been challenged by Karlsruhe. Markets don't seem to be taking much notice of this at the moment, but I think that is because they are preoccupied with Fed tapering, BoJ activism and - above all - the growing risk of a financial crisis in China. Compared to the last of these, the Eurozone looks like a safe haven. And don't forget the monetary idiots out there who are investing in the Euro because the ECB is now the only major central bank that has not done QE.
TravisV here from themoneyillusion comments section.
DeleteCouple points:
(1) I'm not an authoritative expert. I imagine someone like Sadowski, Sumner or Beckworth would be better at finding the relevant data and interpreting it than me.
(2) I'm not sure Sumner or Sadowski would consider bond prices a reliable indicator. In general, we don't consider them to be very reliable here in the U.S. With bond price changes, it's difficult to disentangle changes in the liquidity effect, income effect, price level effect and the expected inflation (Fisher) effect.
I think they consider changes in TIPS spreads the most useful indicator of all. Is there anything equivalent in Europe? After that, I think stock prices are considered the second-most useful (for gauging the impact of surprise changes in policy).
Travis,
DeleteNo, there is no equivalent of TIPS spreads in Europe. And because most financing in Europe comes from banks not stocks, stock markets are nowhere near as useful as they are in the US. Bond markets are much more significant.
Americans really need to look beyond their own borders. Europe is very different from the US.