Why the ECB won't do QE
Or anything else, for that matter. (But they might talk about it.)
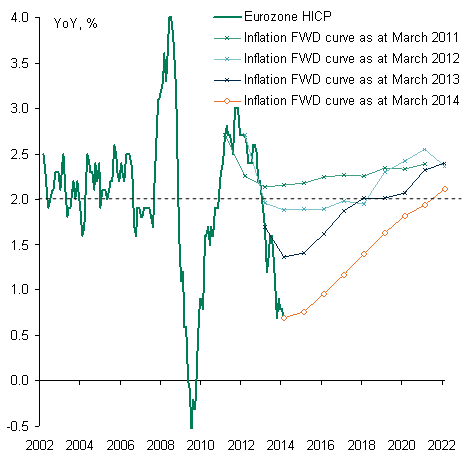
With forecasts like these, who needs action?
H/t Frederick Ducrozet (@fwred on Twitter)
With forecasts like these, who needs action?
H/t Frederick Ducrozet (@fwred on Twitter)

TravisV here from themoneyillusion comments section.
ReplyDeleteFrances Coppola,
What is your theory for why Spanish and German stocks have increased so much since Monday?
Here are the increases of certain stock indices since Monday:
Spain:
MADX: 3.9%
IBEX: 4.0%
Germany:
HDAX: 3.8%
DAX: 4.1%
Europe:
STOXX 50: 3.5%
Bloomberg Euro 500: 2.7%
I calculated those increases using www.bloomberg.com
EM fallout due to Fed tapering and China. Not much to do with Europe.
DeleteIs that called a gathering tsunami?
ReplyDeleteYou may be right, but there is one point Draghi is well aware. The so called Fiscal Compact requires EZ countries debt/gdp ratio to fall below the threshold of 60% at an annual pace by 1/20. For example for Italy it would be more than 3%. Given the slow economic recovery forecasted, this goal becomes impossible to be achieved if inflation remains well below the ECB target (close to 2%) for so long.
ReplyDeleteIndeed it does. But as the chart shows, the ECB's forecast is for inflation to rise.
Delete... to rise close to 2% in 2021: 7 years
DeleteSomehow, this reminds me of a similar chart of several years of the IMF's predictions for Greek growth. The predictions got steadily worse year by year, but remained relentlessly optimistic.
ReplyDeleteYou mean this chart? http://www.zerohedge.com/sites/default/files/images/user5/imageroot/2013/06/Greece%20GDP%20troika.png
DeleteI tweeted this with the ECB's chart. It's the "hockey stick" approach to forecasting. The UK's OBR has been known to do something similar.
Do you really think that bothers the people who have allowed Greece to remain in deep recession for over six years?
ReplyDeleteIt wouldn't surprise me to see a nice burst of Eurozone gdp growth over the next few quarters , based on Sober Look's credit charts today :
ReplyDeletehttp://soberlook.com/2014/03/eurozones-credit-contraction-continues.html
Every private sector credit market seems to have hit bottom. Time for a big bounce.
Marko
I wish I could share your optimism. Monetary conditions are very, very tight, and the AQR is not done yet. I reckon it will get worse, not better.
DeleteYou might be right , but getting worse more slowly in credit markets usually means "getting better". It could be that we've already seen the best part of the gdp bounce off bottom in 2013 , though , and only more disappointment lies ahead :
Deletehttp://www.marketbusinessnews.com/wp-content/uploads/2014/03/Eurozone-GMI-GDP_min.jpg
Marko
This is an enlightening chart. Do you know anything similar for other central banks?
ReplyDeleteAll major. central banks produce inflation forecasts. The Bank of England's latest "fan charts" are here:
ReplyDeletehttp://www.bankofengland.co.uk/publications/pages/inflationreport/irfanch.aspx
The Cleveland Fed has just produced this interesting paper comparing different inflation forecasts:
http://www.clevelandfed.org/research/trends/2014/0414/01infpri.cfm
"EM fallout due to Fed tapering and China. Not much to do with Europe."
ReplyDeleteOr simply too much saving going on (all those CA surpluses) and not enough assets to buy. Smart money is now back in selective EMs. Otoh in the bigger picture story what is happening now simply takes us all the way back to November 2009 and the collapse of Dubai world. It was the unwillingness of that country's larger and richer partner Abu Dhabi to step up to the plate and bail out its smaller brother that started fuelling concerns that Germany might not be willing to answer for the unsustainable debts of its Greek associate. The solidity of the Euro Area and the willingness of its members to stand together had still to be tested.
This is where the Euro crisis began. Now, nearly four and a half years later, we have bailouts, a banking union and the prospect of full blown QE. Naturally bond yields are adjusting back near to where they were when it all started. The large spreads no longer make sense, and there is easy money to be made on the capital value front as the spreads tighten.
Bottom line: the hedgies made money on the way up from May 2010 to July 2012, and now they have been making it again on the way down.
Edward.
DeleteI hadn't thought of it like that, but that story makes complete sense. And it explains the ECB's reluctance to do QE. QE would create synthetic Eurobonds held by the ECB - debt pooling by the back door, exactly what the German government doesn't want. Markets know this. Hence the falling bond yields.
The explanation of the European bourses run up this week is, in my opinion, off the mark [FC, I can be as close a fan of yours as you can get...]. There are many narratives, as always, but the consensual EM fallout/Fed tapering/rates-rising-hurt-EM is incoherent with EM actually outperforming DM this week. Markets have 1 priced out tail risks geopolitically induced 2 EM ccys strenght has helped stoke infl fears 3 quarter end effects [vague, but there is no uniform narrative on this one, it has impacted markets/stocks in different ways]
ReplyDeleteFair enough. The other explanation is that markets are pricing in expectations of significant ECB easing - QE or negative rates. In my opinion they are wrong to do so, but there is certainly a lot of market chatter along those lines. ECB has been signalling an easier stance, but that doesn't mean they will actually do anything. Talking about it may have the desired effect - worked with OMT, after all.
Delete