Reconciling IS-LM and endogenous money

This post was sparked by conversations with people who have opposing views of how money creation works. Some people think that classical models such as IS-LM don't work with endogenous money theory, therefore the models need to be discarded: others think that there's nothing wrong with the model and the problem is endogenous money theory. Personally I think that simple models like IS-LM can be powerful tools to explain aspects of the working of a market economy, and it behooves us therefore to find ways of adapting them to work with an endogenous fiat money system. So this is my attempt to reconcile IS-LM with endogenous money. I don't claim that it is anything like the final word on the subject, so comments are welcome.
The IS-LM model looks like this:

where M is the quantity of money in circulation, L is the "liquidity preference" (the degree to which investors prefer to hold interest-bearing, less liquid assets rather than to zero-interest, highly liquid money), I is investment and S is saving. The real interest rate i is on the y axis and real output Y on the x axis. IS-LM is a short-run model, so it ignores inflation: all variables are real.
In the IS-LM model, M is assumed to be fixed: the supply curve for M from which the LM curve is derived is a vertical line. This is hardly surprising, since the IS-LM model is a short-run model dating from a gold standard era.
At this point, of course, endogenous money types say "But M is not fixed - the quantity of money is determined by bank lending", and other sensible people say "But M is not fixed - the quantity of money is determined by the central bank". These are actually both correct in different ways, but that doesn't necessarily invalidate the model.
I had a long argument with Scott Sumner about the definition of M, the details of which I won't repeat here. Suffice it to say that for the purposes of this post, he wins. On this occasion I'm defining M as the monetary base M0, not the total amount of "money" (broadly defined) in circulation. Defining M in this way neatly avoids the "moneyness" problem and actually enables the IS-LM model to work with endogenous money theory, as I shall show. Liquidity preference L simply becomes the private sector's preference for "outside money" (physical currency and bank reserves) versus all other assets including bank "credit" money ("inside money").
The IS curve shows the equilibrium between saving and investment that holds at all times: S = I. At this point endogenous money types remind us that banks don't need deposits in order to lend, so saving doesn't precede investment. Indeed it doesn't. The S=I identity says nothing about the direction of causation. The prevalent belief that "you need saving in order for there to be investment" is a misinterpretation of this identity. It would be equally accurate to say that investment drives saving, and in an endogenous money system this is closer to how it works in practice. Either way, the S=I identity holds. The IS curve is therefore as relevant in an endogenous money system as it is in a "loanable funds" system.
Indeed, endogenous money types really need to understand the importance of the IS curve. In the IS-LM model, demand for M is inversely proportional to demand for credit. The intersection of the IS curve with the LM curve tells us the relative demand for credit versus M for a given combination of interest rate and GDP.
Of course, the IS curve does not simply represent bank lending: after all, investment does not have to involve borrowing. But almost all the "money" circulating in the economy, and all of the money held in bank deposit accounts, is created when banks lend. Therefore even if an asset is purchased from existing savings, bank lending is still involved. The savings themselves are the result of an earlier lending transaction: one person's debt is another person's savings. So we can regard the position of the IS curve as an indicator of "credit money" supply - or credit demand, if you prefer: it's the same thing.
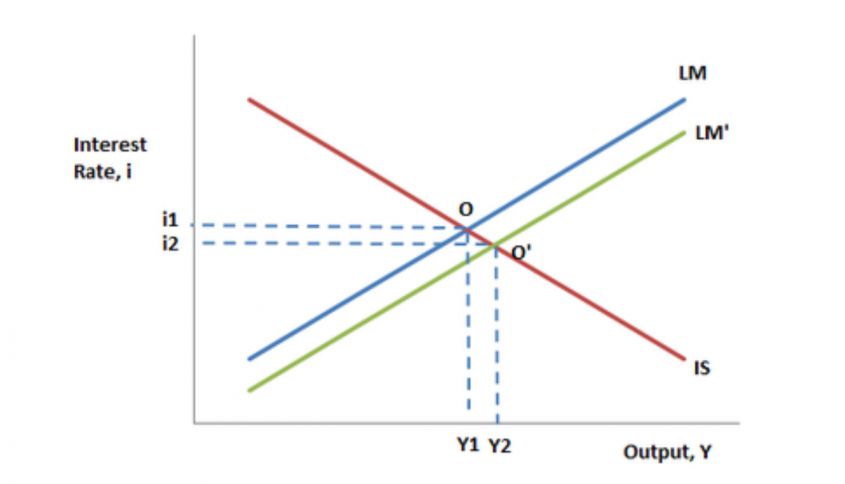
The IS curve shifts in response to changes in demand for credit relative to M. I visualise this as the IS curve "sliding" up and down the fixed LM curve:

(an interactive graphic that did this would be REALLY neat!)
In endogenous money language, when the IS curve shifts leftward and the intersection with the LM curve moves downward, demand for loans has reduced and therefore "inside money" has fallen relative to "outside money": when the IS curve shifts rightward, demand for loans increases and "inside money" rises relative to "outside money". Classical monetary economics would say that the money multiplier (ratio of credit money to monetary base) increases as credit demand rises and decreases as credit demand falls.*. It's the same thing.
The IS-LM model shows us that real interest rates and output rise as demand for M falls and credit money increases, and fall as demand for M rises and credit money is destroyed. It's an excellent depictor of the procyclicality of bank credit creation. The ultimate "slide down the LM curve" is the classic bank run, when depositors reject credit money in favour of M (physical cash). It is hardly surprising therefore that bank runs are associated with sudden disastrous falls in Y.
I've implicitly assumed here (in accordance with endogenous money theory) that changes in credit demand (or supply, if you are a "bash-the-banks" supporter) drive changes in interest rates and GDP. But the model actually doesn't say this. Endogenous money theory says changes in demand for credit are causative. Scott Sumner says changes in interest rates are causative. Supply-side shocks to output would also be causative. In fact any or all of these would cause the IS curve to shift. The IS-LM model doesn't tell us the cause: all it does is model the relationship.
It is very easy to misunderstand the IS-LM model. For example, it shows that falling interest rates are deflationary. Therefore, some will say, we should raise interest rates in order to increase investment and output. No, absolutely not. The model does not imply that. The interest rate in IS-LM is the equilibrium rate, not the policy rate. If the central bank responded to falling output by raising the policy rate, that would reduce M (because central banks raise policy rates by draining reserves), which would shift the LM curve to the left. If the LM curve shifted to the left, the equilibrium interest rate would rise, but Y would fall even more. Raising interest rates is not the best medicine for a stagnant, fragile economy.
And this brings me to how the IS-LM model works when M is not fixed. Prior to 2008, M responded to credit demand. This is the reason why endogenous money types say the money multiplier is a myth. If M responds to credit demand, the IS curve remains at the same position and the LM curve shifts as M changes. The money multiplier is still present, but it is a more-or-less constant ratio and therefore not much use as an indicator of the relationship between the money supply and the price level.
M also is not fixed if IS-LM is used as anything other than a very short-run model, because then inflation must be taken into account. Real M = nominal M/price level P. Of course an inflation-targeting central bank doesn't allow P to change much, does it? Umm.....
I can't leave this subject without considering the thorny problem of excess reserves, though. In most developed countries, M is currently increasing rapidly due to exogenous actions of the central bank, not credit demand. Does this model still work when M far exceeds the amount needed to intermediate payments?
Well yes, the model itself still does. Increasing M is gradually shifting the LM curve to the right, which raises Y. This suggests that low though it is, output would be even lower without the increase in M. But exactly how this works is an open question. How many articles, academic papers and even books have there been now on the effects of unconventional monetary policy?
The question is not whether the model works with excess reserves, but whether it tells us anything useful. What it shows is that Y would be much lower if it were not for the increase in the monetary base due to unconventional policy. This supports the argument of those who claim QE and its relatives prevent1930s style depressions. What it does not support, though, is the argument of those who claim that QE and its relatives can neutralise the effects of inadequate deliberately contractionary fiscal policy. IS-LM cannot tell us where Y would have been had fiscal policy not been inadequate or contractionary. Nor does it suggest that expansionary monetary policy alone can engineer recovery. To establish that, we need far more than one simple model.
IS-LM is only a model: although it helps us understand the relationship between money and economic activity, it doesn't tell us how things work in reality, and it doesn't model the uncertainties and complexities of a modern market economy. And it can't be used to predict a future path. It's a powerful tool, but we should respect its limitations.
Related reading:
Interest rates and deflation, and Scott Sumner's response
IS-LMentary - Krugman (paywall)
Money creation in the modern economy - Bank of England
IS-LM vs. Minsky - Lars P. Syll
Dare to be Silly - Krugman (paywall)
Keynes and the Quantity Theory of Money
No, please don't show me your model
This article was originally posted on Pieriaview on 29th March 2014. It has been slightly updated to reflect developments since. The original post can be found here, and comments on it here.
*The money multiplier has been widely misinterpreted as an ex ante determinant of the amount of money that banks are "allowed" to create, when it is actually an ex post descriptor of the amount of money banks HAVE created in relation to base money - i.e. the demand for credit, which is an important driver of nominal GDP.

I haven’t read the full post but thought this for a while. The implication in my mind of an inflation targeting central bank is a flat LM curve, up to the point at which supply equals the supply capacity of the economy. Beyond this point the central bank responds to increase in Y above that level with a tight monetary policy. The LM curve in this world looks more like two sides of a square than an upward sloping line determined by the intersection of the (fixed) supply and (downward sloping) demand for money.
ReplyDeleteThe big problem with the money multiplier is that it gives students a false understanding of the monetary system. Students have to unlearn the theory in order to understand endogenous money, before relearning the multiplier as nothing more than a descriptive statistic that simply reflects the ratio of broad to base money.
Hi,
ReplyDeleteHappy New Year!
In what way can it be regarded as a "powerful tool", when, according to your last paragraph,
"it doesn't tell us how things work in reality, and it doesn't model the uncertainties and complexities of a modern market economy. And it can't be used to predict a future path"
It sounds like it is useful only looking in the rear mirror at a simple, even trivial, model of the economy, in a highschool economics class......
This comment has been removed by a blog administrator.
ReplyDeleteThis comment has been removed by a blog administrator.
ReplyDeleteKeynes' Liquidity Preference Curve is a false doctrine with interest being paid on demand deposits.
ReplyDeleteWith the current censorship, it's a dystopian world. The definition of money has never changed. Money” is the measure of liquidity; the yardstick by which the liquidity of all other assets is measured.
ReplyDeleteSumner doesn't know money from mud pie.
But you have a big problem with the IS = LM framework. It's called the distributed lag effect of money. That's the secret to what money is or is not.
Economists don't know a debit from a credit. The economic engine, the savings / investment channel (liquidity risk and maturity transformation), is being run in reverse. $15 trillion dollars in member bank-held savings is frozen, is un-used and un-spent, is lost to both consumption and investment (is an unrecognized leakage in Keynesian National Income Accounting). This is the proximate cause of the deceleration in velocity since 1981. It's stock vs. flow.
ReplyDeleteAll monetary savings originate within the payment's system, the source of interest-bearing deposits is other bank deposits (derivative deposits). And the source of bank deposits (loans = deposits), or commercial bank credit, has evolved since the remuneration of IBDDs, into staid injections of Reserve Bank credit (bifurcated balances between banks and nonbank customers).
The only percipient way to activate bank-held savings is exclusively dependent upon their owners, saver-holders, to spend/invest either directly or indirectly entirely outside of the payment’s system, e.g., in a NBFI conduit.
Banks don’t loan out deposits. Deposits are the result of lending. In fact, it's virtually impossible for the DFIs to engage in any type of activity involving its own non-bank customers without an alteration in bank deposits (synonymous with the money stock).
The upshot is cataclysmic. Economists say that “long-term neutral rate of interest, R *” has fallen. And this means: ”to avoid the zero lower bound on the funds rate – this fall in the neutral rate may well need to be met with an increase in the long-run inflation target set by the Fed.” And that was in 2017. Economists aren’t learning. “Those who cannot remember the past are condemned to repeat it”
We know the approximate trend in inflation. It will accelerate rapidly. This is determined by American Yale Professor's truistic "equation of exchange', where N-gDp is both a subset and proxy of aggregate monetary flows or AD. Note that inflation is reported with a one money lag.
ReplyDelete08/1/2020,,,,,0.68
09/1/2020,,,,,0.68
10/1/2020,,,,,0.76
11/1/2020,,,,,0.86
12/1/2020,,,,,1.24
01/1/2021,,,,,1.29
02/1/2021,,,,,1.25
03/1/2021,,,,,1.19
04/1/2021,,,,,1.23 inflation peaks
05/1/2021,,,,,1.19
We now know that the top in real economic activity is 12/2020. Therefore the approximate top in stocks is January (without a decoupling).
ReplyDeleteMoney flows:
08/1/2020,,,,,0.56
09/1/2020,,,,,0.52
10/1/2020,,,,,0.6
11/1/2020,,,,,0.82
12/1/2020,,,,,0.87 top
01/1/2021,,,,,0.55 stocks fall
02/1/2021,,,,,0.49
03/1/2021,,,,,0.41
--Michel de Notredame
Stocks falling as predicted.
DeleteI think I asked this exact question - we don't live in a gold standard world, does it work with a sloping supply curve for money? - in the lecture where I first learned IS/LM in the autumn of 2000.
ReplyDeleteIt’s stock vs. flow. QE-forever does exactly the opposite of what the advocates of N-gDp level targeting says is important (“It is the real interest rate that affects spending”, pg. 19 Marcus Nunes and Benjamin Cole’s “With Market Monetarism – a Roadmap to Economic Prosperity”).
ReplyDeleteAdding infinite and misdirected money products (LSAPs on sovereigns) while remunerating IBDDs (inducing nonbank disintermediation), generates negative real rates of interest; has a negative economic multiplier; stokes asset bubbles (results in an excess of savings over real investment outlets); exacerbates income inequality, and depreciates the exchange value of the U.S. $.
Whereas the regulatory release of savings invokes a spontaneous chain reaction, an expanding sequence of reactions, a self-propelling and amplifying chain of events.
The activation and discharge of $15 trillion of finite savings products (near money substitutes), via targeted real investment outlets has a positive economic multiplier, a ripple effect (increases productivity and real wages), while increasing both the real rate and nominal rates of interest.
No, contrary to Bankrupt-u-Bernanke’s claim that: “Money is fungible”…“One dollar is like any other”, pg. 357 in “The Courage to Act”, the utilization of savings is a catalyst, it is not a matching of economic accounts, not a 1-2-1 economic transaction (correlation between two sets). This is demonstrated by debits to particular deposit accounts.
“In economics, a multiplier broadly refers to an economic factor that, when increased or changed, causes increases or changes in many other related economic variables. In terms of gross domestic product, the multiplier effect causes gains in total output to be greater than the change in spending that caused it.”
It’s a disputation of the Gurley-Shaw thesis (that there is no difference between money and liquid assets).
N-gDp LPT is nothing other than stagflation reincarnated. It caps real output and maximizes inflation.
See: “Should Commercial Banks Accept Savings Deposits?” Conference on Savings and Residential Financing 1961 Proceedings, United States Savings and loan league, Chicago, 1961, 42, 43.
“Profit or Loss from Time Deposit Banking”, Banking and Monetary Studies, Comptroller of the Currency, United States Treasury Department, Irwin, 1963, pp. 369-386
The fact is that an increase in bank CDs adds nothing to GDP. In fact, it shrinks AD.
It’s always a fun mission to demonstrate that ISLM is not wrong – it’s perceived as “wrong” only in the eyes of those who are unable to integrate real world institutional complexity into ISLM’s simple framework. The task becomes one of proving that those who reject it inevitably do so based on a lack of understanding about its inherently flexible nature. Nevertheless, I think a better way of approaching the same subject is to work through real world, multi-dimensional institutional complexity, step by step, example by example, and bypass the ISLM model altogether. That becomes the task with or without the actual graph of ISLM. It’s an old, awkward, and not very attractive starting point. Still, those who reject it outright mostly don’t know what they’re talking about.
ReplyDeleteJKH