UK inflation and the oil price
Inflation is back.
Here is the change in the consumer price index (CPI) for January 2017, according to ONS:
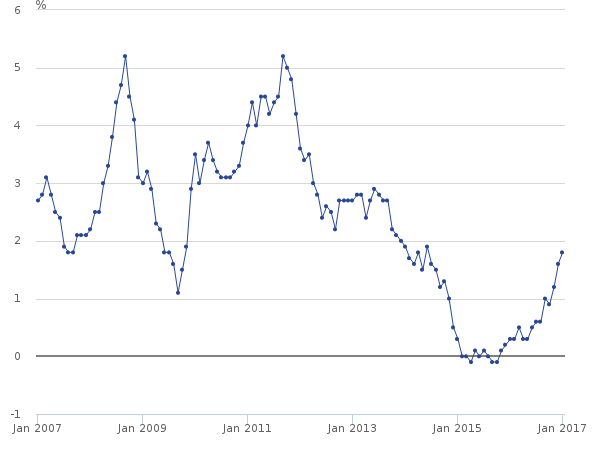
Well, this doesn't look too serious. CPI is barely reaching the Bank of England's target of 2%. It has been much higher for most of the last decade, and yet the Bank of England has kept interest rates at historic lows.
But consumer price inflation - the prices that people pay for goods in the shops - is only one side of the equation. On the other side is producer price inflation (PPI), the prices that companies pay for the materials and energy they need to produce goods and services. The picture here is entirely different, as this table from ONS's January 2017 producer price inflation report shows:
 Annualised producer price inflation has risen dramatically in the last six months. It reached double digits in October 2016 and currently stands at an astonishing 20.5%. Most of that is due to sharply rising import prices, of which by far the most important is crude oil, the price of which has risen by 82% in the last year. The dominance of oil imports in producer price inflation figures is evident from this chart:

Rising oil prices in the last year have added 9% to producer prices.
But inflation is a rate-of-change measure: it tells you how fast prices are rising, but not where they started from. Just over a year ago, we were looking at this chart:

In October 2015, ONS reported an entire year of double-digit deflation in producer prices, due to a 40% fall in the oil price and significant price falls in other imports:
 So we could regard imports as simply returning to a more normal price level after the unwinding of the oil and commodities bubble. But what is a "normal price level"?
It turns out that import prices and the oil price are joined at the hip. So there is no such thing as a "normal price level" that ignores movements in oil prices. This chart shows producer price inflation since 2002:
 And this chart shows the price of Brent crude since 2002:

Even just eyeballing these, the correlation is evident. For the whole of this century, the oil price has been the single biggest driver of producer price inflation in the UK. And judging by the CPI chart at the head of this post, it appears to be a significant driver of consumer price inflation too.
The other major driver of producer price inflation in the last 6 months has been the falling sterling exchange rate. Sterling is down by 13% against the US dollar. This explains the apparent divergence between the rate at which the oil price is rising and the rate at which inflation (PPI and CPI) is rising. Brent is quoted in US dollars per barrel, so its price in sterling is rising faster than its dollar price.
However, the rising oil price is evidently not being significantly passed through to consumer prices. A producer price rise of 20% is resulting in CPI of less than 2%. In fact the chart above shows that none of the swings in producer price inflation this century have been fully passed through to consumer prices - including the extraordinary speculative oil price spike just prior to the financial crisis and the QE-driven oil and commodity price bubble of 2010-14. Clearly, businesses have chosen to absorb the costs rather than passing them on to consumers. So where have the effects of these price rises been felt?
This is part of it:

Note the inflection point in 2007. For the next seven years, real wages fell, and they are still barely growing. Producer price inflation was not passed on to consumers - it was passed on to workers, in the form of wage growth that failed to keep up with consumer price rises.
Producer price inflation was also passed on in the form of poor productivity. Rising energy costs are particularly destructive to productivity, since rising productivity by definition increases energy usage. The picture is one of businesses trying to avoid passing costs on to consumers by restricting both wage growth and energy use. We would expect this to show up as lower output. And indeed, this is what we find:
 (source: ONS Gross Domestic Product time series January 2017)
UK output fell off a cliff in 2007, then tried to recover in 2009-10 but was clobbered by rising oil and commodity prices. I have previously observed that the UK in 2010-12 suffered double-digit inflation in energy prices, which in my view was the principal reason why the UK economy flatlined. If the QE-driven oil and commodity price bubble was the principal cause of the failure of the UK's recovery, then the prolonged use of QE by the US to restore its own economy has had terrible consequences for the UK. QE spillovers are known to be inflationary for emerging markets, but it seems that there was also an indirect inflationary effect in oil-dependent developed countries, which showed itself as stagnant output, poor productivity and flat wage growth.
If this is correct, then the falling oil price of the last two years has been the single biggest reason for the UK's improving output and wage growth. But now the oil price is rising and sterling is falling (which amplifies the depressing effect of the rising oil price on the UK economy). The little boom is over. If the oil price continues to rise, I expect wage growth to stall and output to flatline again. And if businesses do start to pass on these costs to consumers, then the Bank of England will additionally come under pressure to raise interest rates. This does not look promising to me.
However, the point of this post is not to remind everyone that my middle name is Cassandra. It is to highlight the critical dependence of the UK economy on the oil price, and to a lesser extent on imported commodities. The Bank of England's monetary policy is fairly effective at discouraging businesses from passing on import price rises to consumers. But we pay for this through inadequate wage growth, low productivity and poor output. Would it be better if businesses passed the costs on? Would significantly higher inflation in the medium-term be a reasonable price to pay for improved output and wage growth? Those who argue for a higher central bank inflation target are in effect saying that it would.
Of course, there are other moving parts in the productivity-wages-output puzzle. For example, I have not in this post discussed the effects of public sector wage freezes and the entry to the workforce of previously economically inactive people such as single mothers, sick & disabled and older women. And I have completely omitted the effect of damaged banks cutting back productive lending in order to repair their balance sheets. But the impact of the oil price on the economy is widely ignored, not least because the focus is entirely on consumer price inflation. Yes, a central bank can dampen the effect of oil price rises on consumer price inflation. But it cannot protect businesses from rising costs due to oil and commodity price rises. Perhaps, in future, we should pay far more attention to the direct effects of imported inflation on the supply side, rather than obsessing about consumer prices. After all, it is the supply side that ultimately drives economic growth and prosperity.
Related reading:
What derailed the UK recovery?
Inflation, deflation and QE
Inflation report, February 2017 - Bank of England
Here is the change in the consumer price index (CPI) for January 2017, according to ONS:

Well, this doesn't look too serious. CPI is barely reaching the Bank of England's target of 2%. It has been much higher for most of the last decade, and yet the Bank of England has kept interest rates at historic lows.
But consumer price inflation - the prices that people pay for goods in the shops - is only one side of the equation. On the other side is producer price inflation (PPI), the prices that companies pay for the materials and energy they need to produce goods and services. The picture here is entirely different, as this table from ONS's January 2017 producer price inflation report shows:


Rising oil prices in the last year have added 9% to producer prices.
But inflation is a rate-of-change measure: it tells you how fast prices are rising, but not where they started from. Just over a year ago, we were looking at this chart:

In October 2015, ONS reported an entire year of double-digit deflation in producer prices, due to a 40% fall in the oil price and significant price falls in other imports:

It turns out that import prices and the oil price are joined at the hip. So there is no such thing as a "normal price level" that ignores movements in oil prices. This chart shows producer price inflation since 2002:


Even just eyeballing these, the correlation is evident. For the whole of this century, the oil price has been the single biggest driver of producer price inflation in the UK. And judging by the CPI chart at the head of this post, it appears to be a significant driver of consumer price inflation too.
The other major driver of producer price inflation in the last 6 months has been the falling sterling exchange rate. Sterling is down by 13% against the US dollar. This explains the apparent divergence between the rate at which the oil price is rising and the rate at which inflation (PPI and CPI) is rising. Brent is quoted in US dollars per barrel, so its price in sterling is rising faster than its dollar price.
However, the rising oil price is evidently not being significantly passed through to consumer prices. A producer price rise of 20% is resulting in CPI of less than 2%. In fact the chart above shows that none of the swings in producer price inflation this century have been fully passed through to consumer prices - including the extraordinary speculative oil price spike just prior to the financial crisis and the QE-driven oil and commodity price bubble of 2010-14. Clearly, businesses have chosen to absorb the costs rather than passing them on to consumers. So where have the effects of these price rises been felt?
This is part of it:

Note the inflection point in 2007. For the next seven years, real wages fell, and they are still barely growing. Producer price inflation was not passed on to consumers - it was passed on to workers, in the form of wage growth that failed to keep up with consumer price rises.
Producer price inflation was also passed on in the form of poor productivity. Rising energy costs are particularly destructive to productivity, since rising productivity by definition increases energy usage. The picture is one of businesses trying to avoid passing costs on to consumers by restricting both wage growth and energy use. We would expect this to show up as lower output. And indeed, this is what we find:

UK output fell off a cliff in 2007, then tried to recover in 2009-10 but was clobbered by rising oil and commodity prices. I have previously observed that the UK in 2010-12 suffered double-digit inflation in energy prices, which in my view was the principal reason why the UK economy flatlined. If the QE-driven oil and commodity price bubble was the principal cause of the failure of the UK's recovery, then the prolonged use of QE by the US to restore its own economy has had terrible consequences for the UK. QE spillovers are known to be inflationary for emerging markets, but it seems that there was also an indirect inflationary effect in oil-dependent developed countries, which showed itself as stagnant output, poor productivity and flat wage growth.
If this is correct, then the falling oil price of the last two years has been the single biggest reason for the UK's improving output and wage growth. But now the oil price is rising and sterling is falling (which amplifies the depressing effect of the rising oil price on the UK economy). The little boom is over. If the oil price continues to rise, I expect wage growth to stall and output to flatline again. And if businesses do start to pass on these costs to consumers, then the Bank of England will additionally come under pressure to raise interest rates. This does not look promising to me.
However, the point of this post is not to remind everyone that my middle name is Cassandra. It is to highlight the critical dependence of the UK economy on the oil price, and to a lesser extent on imported commodities. The Bank of England's monetary policy is fairly effective at discouraging businesses from passing on import price rises to consumers. But we pay for this through inadequate wage growth, low productivity and poor output. Would it be better if businesses passed the costs on? Would significantly higher inflation in the medium-term be a reasonable price to pay for improved output and wage growth? Those who argue for a higher central bank inflation target are in effect saying that it would.
Of course, there are other moving parts in the productivity-wages-output puzzle. For example, I have not in this post discussed the effects of public sector wage freezes and the entry to the workforce of previously economically inactive people such as single mothers, sick & disabled and older women. And I have completely omitted the effect of damaged banks cutting back productive lending in order to repair their balance sheets. But the impact of the oil price on the economy is widely ignored, not least because the focus is entirely on consumer price inflation. Yes, a central bank can dampen the effect of oil price rises on consumer price inflation. But it cannot protect businesses from rising costs due to oil and commodity price rises. Perhaps, in future, we should pay far more attention to the direct effects of imported inflation on the supply side, rather than obsessing about consumer prices. After all, it is the supply side that ultimately drives economic growth and prosperity.
Related reading:
What derailed the UK recovery?
Inflation, deflation and QE
Inflation report, February 2017 - Bank of England
Hi Francis,
ReplyDeleteYou have discussed a topic that has interested me for years. Despite trying to making sense of it all, I have disappointingly failed. Things just don't seem to work the way they "should".
Take currencies.
The GBP took a huge lurch down of 25% against the EUR and the USD around 2008, somehow this never really came through as a lurch in the CPI number. I wonder if the economists at ONS have some massage technique to remove any perceived short term price fluctuations? This would make some sense, as there are several important prices tied to it, for example wages and pensions. Also the "real GDP" is reported net of the inflation deflator.
A wildly swinging inflation number is going to make things difficult, as pensions, for example would ratchet up an extra notch in a short term high inflation environment, but would then not come down afterwards. And the real GDP would go up and down sending the UK into paper recessions and booms.
Production versus productivity.
"since rising productivity by definition increases energy usage."
Surely productivity is the efficiency of production? Something the Brits have been falling down at. I understand rising productivity as more output per unit of input, so there is not necessarily an increase in energy use per unit of production, it could, and indeed has often, fallen.
I am not sure about the conclusion, "After all, it is the supply side that ultimately drives economic growth and prosperity", the world has a huge production capacity, but if the workers do not have cash in their pockets it will all sit idle. For growth and prosperity surely
1. The workers need to be more productive
2. They have to be proportionately remunerated so they can actually buy the stuff.
We are globally good at #1, but notoriously bad at #2.
The banks have certainly not cut back on consumer finance.
"Average debt - excluding mortgages and student loans has now surpassed its previous record of £14,950 to reach £17,630 in winter 2016/17: an increase of 18 per cent."
The BoE is backed firmly into a corner. With all that increased relatively low interest debt around, even if inflation starts up, any increase in interest rates will be somewhat hard for the consumers to bear.
The paddles have long been lost overboard on the way up this creek....... I believe that the bailers are also gone and the canoe is decidely leaky.....
Regards,
Richard.
Hi Richard,
DeleteTraditionally, the biggest input cost by far is labour. When labour costs rise relative to prices (or prices fall relative to nominal wages, as in a recession), companies tend to put workers on short hours to keep the costs down. Inventory, too, is a cost, so if production outstrips sales, companies may slow down production by - for example - running machines at half capacity, or laying off workers. In these days of high energy prices, however, energy has become a much more significant business cost. So companies respond to high energy prices the way they do to high labour costs: if they are confident about sales and have inventory capacity they try to increase productivity, but if they are not confident about sales, they try to reduce costs by under-using both machines and workers. Hence high energy prices can feed into both poor output and low wages by reducing, not increasing productivity. Underlying this is lack of confidence about the economy - so we also see hoarding behaviour by companies (excessive saving).
"You have discussed a topic that has interested me for years. Despite trying to making sense of it all, I have disappointingly failed. Things just don't seem to work the way they "should".
Delete"
Me too.
Great definition of the problem! Is should relevant? I have gone or am going through the same thing.
Who told you the way things should go? Why?
But, what actually happened and happens?
History and accounting are better informers than economic theory, economic propaganda, political economics, and economic marketing.
Are British producers substantially more oil-dependent than those in other countries, and if so, then why?
ReplyDeleteFrancis,
ReplyDeleteHas Japan as another energy importing nation shown the same effects as you suggest for the UK?
Sterling devaluation I believe has been exacerbated by the last rate cut by the BoE following the Brexit vote and a mistake leaving it with fewer options in the future.
'It's the supply side that ultimately drives the economy'.
ReplyDeleteI see it's a v complex question but how did you get to that conclusion so quickly from the first part where you discuss distribution.
Surely the argument could read:
QE boosts asset prices and depresses fx rate > commodity inflation > cost push inflation in tradable sector (priced in dollars) > distribution away from service sector (priced in sterling) > weak labour market institutions so adjustment forced onto wages > wage growth lags productivity > low investment due to plentiful cheap labour and low confidence > rinse and repeat > hysteresis > missing productivity infrastructures and capacities > fragility in face of supply shocks.
It's not simply the oil price or the supply side per se but the distributional impact of weak labour market institutions holding down the wage share in a wage led demand economy that's driving the investment story. Kalecki was right to point out that profits alone don't drive investment.
Everyone keeps forgetting that theres millions of elderly pretty much wholly dependant on savings income who simply cannot and will not spend ..until the B of E actually faces the huge loss that is creating throughout the economy the country will stagnate the flush of spending by those with cheap mortgages has reached its peak and they are finally realising they cannot repay the debt they have racked up ...wheras the prudent could have spent from a position of strength only fools get into debt or think its a solution and the prime idiots on that score is B of E who have consistantly pushed ever cheaper debt whilst robbing the prudent of spending power They will wake up far far too late of course and the country will be wrecked
ReplyDeleteInflation has been so bad over the decades that you can't accurately call some one a gold digger. You would be better saying currency digger.
ReplyDeleteThe use of that term existed when there was gold money.
Gold Diggers of 1933 - "We're in the Money"
https://www.youtube.com/watch?v=UJOjTNuuEVw
Interesting year of that film.